How does ENERWA perform water quality sampling?
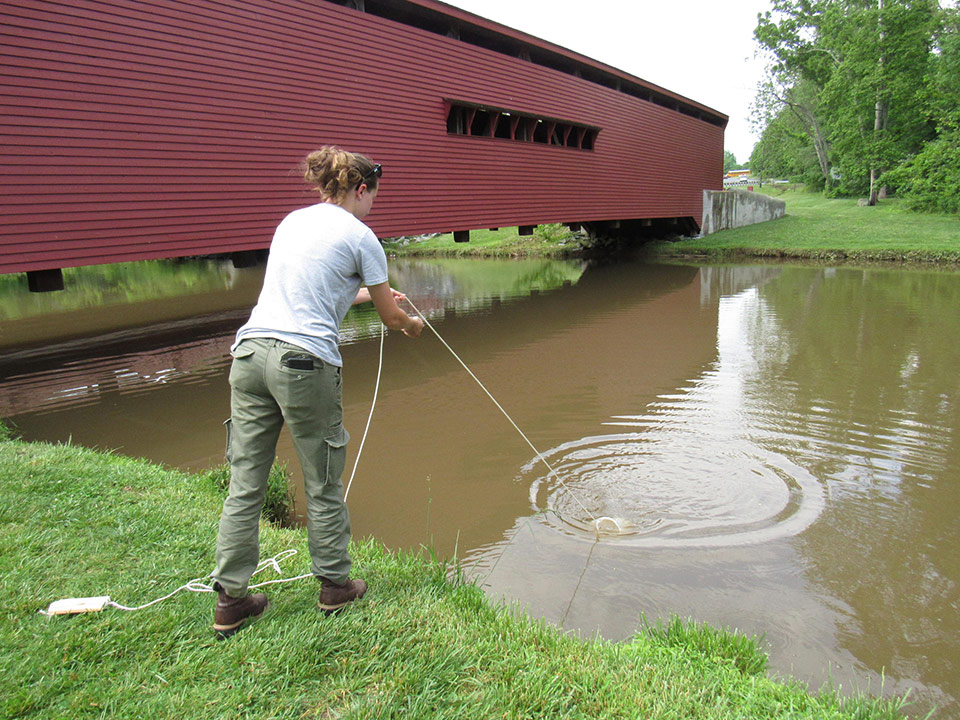

What do we measure and why is it important?
-
Air and water temperatures
-
pH
-
Total nitrogen
-
Conductivity
-
Total phosphorus
-
Dissolved oxygen
-
Water clarity (turbidity)
Nitrogen, phosphorus, and sediment are the three pollutants addressed by the Bay’s “pollution diet” overseen by the EPA. In our measurements, total nitrogen, total phosphorus, and water clarity are the parameters that directly relate to these pollutants. Conductivity is another measure of undesirable solids dissolved in water, and dissolved oxygen tells us how well a waterway can support living things.
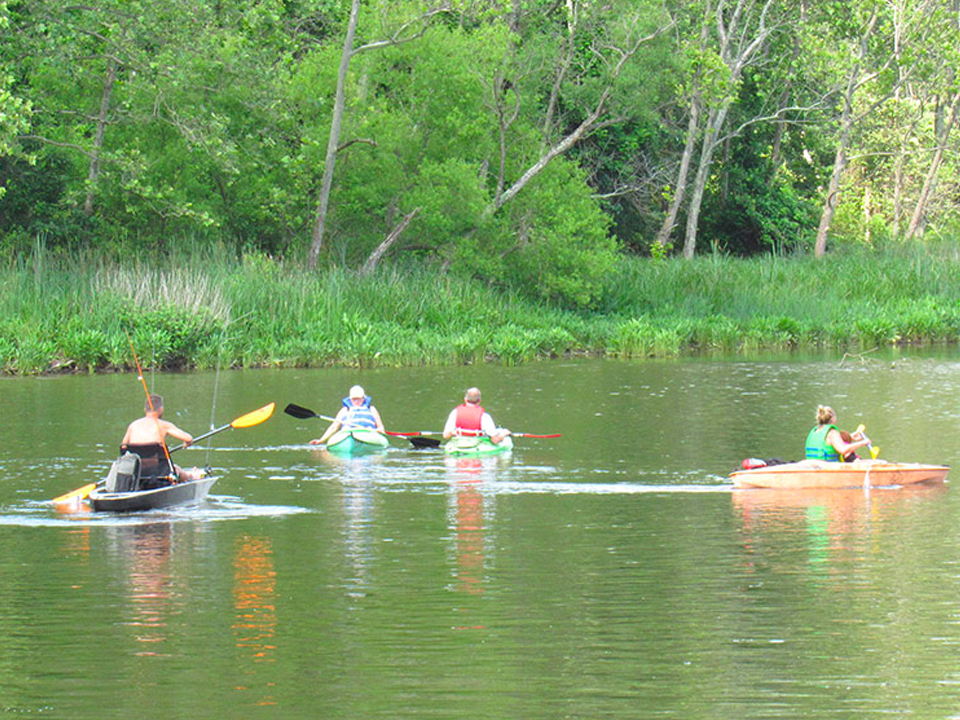
How Can You Help?
We can all help to improve water quality.
Click Here for More Information.
What sites are now being monitored?

North East River Watershed

Elk River Watershed

How is the grade calculated?
View the raw ENERWA data at each site on the Chesapeake Monitoring Cooperative (CMC) Data Explorer, which is maintained by the Alliance for the Chesapeake Bay.
The tables on the left show the complete scorecards, according to the MTAC protocols, for our 2021 measurements. Dissolved oxygen is not scored for the upstream sites (although it is used as a check) because oxygen is generally good in flowing streams. Conductivity is not scored for tidal sites because it is very sensitive to changes in salinity (salt content).
The differences in scoring from 2020 to 2021 are indicated by the small marks on the right side of each box, where ↑ means better in 2021, ↓ means worse, and = means the scores for the two years are the same.
Note the high nitrogen content for most of the upstream sites in both watersheds, and the poor water clarity in all the tidal sites. The GRM site in the Elk watershed is the best site overall, because Gramies Run, sampled there, drains wooded land in Fair Hill.